By Olivia Ashmoore
This week, Energy Innovation Policy & Technology LLC® and RMI published 48 state Energy Policy Simulator (EPS) models. The free, open-source, peer-reviewed, and nonpartisan EPS model empowers users to analyze the effects of hundreds of climate policies. EPS users can design policy packages that achieve net-zero greenhouse gas (GHG) emissions across the economy and pinpoint which policies are most effective at reducing emissions while creating economic and health benefits.
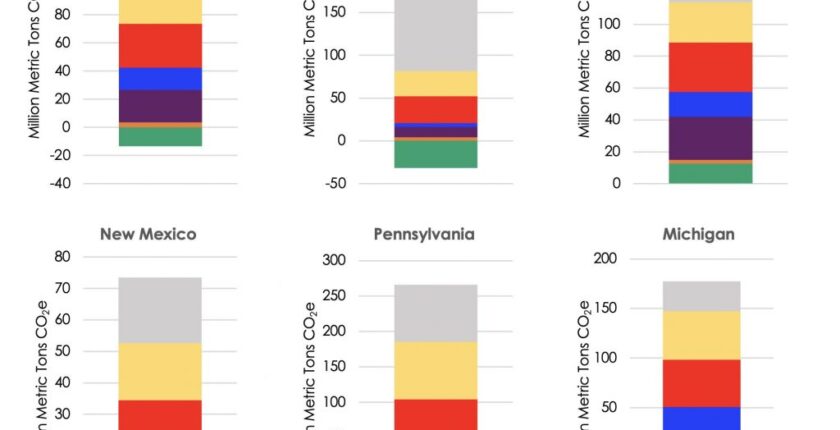
To illustrate how the EPS can inform state action, Energy Innovation® and RMI developed a five-policy scenario and modeled this policy package across six states. The six states have unique emissions profiles with Louisiana, Pennsylvania, and New Mexico having the largest industrial sectors, Minnesota and Michigan the largest transportation sectors, and Wisconsin the largest power sector. Our initial modeling highlights how just five policies, even in states with differing emissions profiles, can significantly cut emissions. Additionally, the five policies generate in-state jobs; our modeling shows that the six states analyzed could see between 13,000 and 118,000 new jobs in 2030. This analysis can help policymakers in any state, regardless of emissions profile, design and implement climate policy.
State EPS models can inform policy to close emissions reduction gaps
The United States government, as well as many state governments, have set ambitious targets to reduce GHG emissions and align with global efforts to solve climate change. While new Inflation Reduction Act investments will spur ample opportunities for transitioning to clean energy, additional state and federal policy action is needed to achieve U.S. climate goals. As states introduce policies to close the gap, policymakers, advocates, and researchers can drive state climate action using data-supported policy analysis.
With the release of the U.S. state EPS models, state policymakers now have detailed GHG emissions data at their fingertips. The state EPS models provide critical information–customized for each state–on forecasted emissions profiles, climate policy effectiveness, and economic impacts. The models provide results in real time, are free to use and modify, and are built using reputable, national data sources.
Energy Innovation® and RMI jointly built the 48 state-level EPS models* using publicly available state and federal data from sources such as the U.S. Bureau of Economic Analysis, U.S. Bureau of Labor Statistics, U.S. Energy Information Administration, the U.S. Environmental Protection Agency, and the National Renewable Energy Laboratory, among others. The models incorporate existing federal and state policy but do not yet incorporate the IRA. Only existing state laws and regulations as of January 2023 are included in the model. Proposed policies are not included, but the model can be used to assess the impacts of such proposals.
More information on our sources and methodology is available at https://docs.energypolicy.solutions/us-state-eps-methodology. The state EPS models are publicly available at https://energypolicy.solutions/us-states and can be run online and downloaded to run locally using free Vensim software.
Top five carbon-cutting policies bring the U.S. closer to meeting climate goals
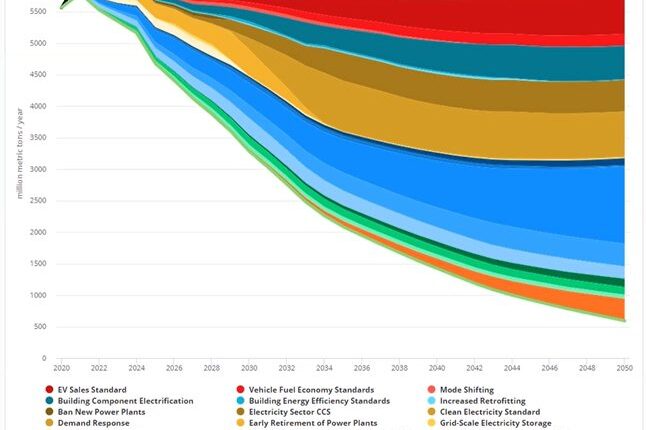
Modeling the five-policy scenario by Energy Innovation® and RMI demonstrates how a small number of policies can effectively cut emissions, in states with quite different GHG sources. The five policies are: clean electricity standards, zero-emission vehicle standards, clean building equipment standards, industrial efficiency and emissions standards, and standards for methane detection, capture, and destruction. Together, these five policies constitute a bold policy plan to slash emissions across a state’s economy.
A Clean Electricity Standard requires retail electricity utilities to meet electricity sales with qualifying clean electricity sources, typically solar, wind, hydro, geothermal, and nuclear power. Many states already have clean electricity standards or renewable portfolio standards in place. In our scenario, we modeled an 80 percent clean energy by 2030 and 100 percent clean by 2035 requirement. In Pennsylvania, this policy accounted for the largest share of emissions reductions.
Zero-Emission Vehicle Standards require a share of newly sold vehicles to be zero-emission vehicles (ZEVs), usually battery electric vehicles. California recently enacted the Advanced Clean Cars II rule, which requires 100 percent light-duty passenger ZEV sales by 2035. Our modeled policy scenario aligns with California’s existing Advanced Clean Cars II rule and California’s Advanced Clean Trucks rule. In Wisconsin, this policy contributes 20 percent of total emissions reductions in the five-policy scenario in 2050.
Clean Building Equipment Standards require new building appliances shift from fossil fuel use in buildings to electricity. To address building sector emissions, newly installed building equipment should be fully electric, beginning with space heating and water heating in new construction, but eventually moving to all end uses in new and existing buildings. We modeled steadily increasing standards that require electric-only equipment in new and existing buildings by 2035. In Michigan, clean building equipment standards contribute 25 percent of total emissions reductions in the five-policy scenario in 2050.
Industrial Emissions Standards shift fossil fuel use to a mix of electricity and hydrogen for low-temperature and medium- to high-temperature heat processes. The modeling also assumes about a 5 percent reduction in fuel use relative to business-as-usual by 2030 with continued progress to 14 percent by 2050 with energy efficiency improvements that help comply with the emissions standard. In Louisiana, because the industrial sector accounts for most of the state’s emissions, industrial emissions standards account for greater emissions reductions than all the other policies combined.
Standards for Methane Emissions require methane leaks—primarily from fossil fuel extraction and transport, agriculture, and landfills—to be identified and captured. The five-policy scenario includes strong methane capture and destruction. The standards result in emissions reductions equal to capturing 100 percent of the potential methane mitigation by 2030 modeled by the EPA. In New Mexico, methane emissions standards contribute 24 percent of total emissions reductions in the five-policy scenario in 2050.
Economic Benefits
The five-policy scenario also yields gross domestic product (GDP) and job benefits for each of the six states. Our modeling shows that the six states analyzed could see between 13,000 and 118,000 new jobs and between 1 percent and 3 percent GDP growth in 2030.
Health Benefits
Policies to transition to clean energy technologies also deliver public health benefits by cutting harmful pollutants such as particulate matter 2.5, sulfur oxides, and nitrogen oxides. Our modeling shows that the six states analyzed could avoid between five and 300 premature deaths annually in 2030 and prevent between 90 and 3,800 asthma attacks and 400 and 20,000 lost workdays annually in 2030.
Conclusion
The state EPS models provide reputable, real-time modeling results and integrated analysis of economic and public health co-benefits. Modeling five policies in six states demonstrates how state EPS models can be used to design policy packages that effectively reduce emissions, create jobs, and improve health. As states develop climate action plans and evaluate how to achieve their GHG targets, the state EPS models are an indispensable tool. Policymakers and other stakeholders can reach out to Energy Innovation® and RMI for assistance by emailing policy@nullenergyinnovation.org.
The post Energy Innovation Policy & Technology® and RMI Launch 48 U.S. State EPS Models appeared first on Energy Innovation: Policy and Technology.
Energy Innovation Policy &Technology LLC® and RMI developed 48 state Energy Policy Simulator (EPS) models to help policymakers design impactful climate policies. To show how the EPS can inform decision-making, Energy Innovation® and RMI modeled a five-policy scenario across six states, finding five top policies that can dramatically cut state greenhouse gas emissions, grow state economies, and prevent thousands of asthma attacks.
The post Energy Innovation Policy & Technology® and RMI Launch 48 U.S. State EPS Models appeared first on Energy Innovation: Policy and Technology.[#item_full_content]