Growing energy costs are driving new financial considerations for homeowners and businesses alike, and heat pumps offer an increasingly cost-effective and reliable alternative to dirty, aging gas furnaces and industrial boilers.
Residential heat pumps are outpacing gas furnace sales[1] as the cost, efficiency, and health benefits of the technology become better understood. Industrial heat pumps can also cut costs and reduce pollution, particularly for low-temperature applications. But how do the economics of heat pumps really compare to the economics of gas equipment? And what about the other clean alternatives out there, like hydrogen?
How do heat pumps work?
Heat pumps can be used in a variety of applications to improve heating efficiency, from residential and commercial buildings to low-temperature manufacturing. For homes and businesses, heat pumps provide a safer, cleaner, and more efficient alternative to gas-fired furnaces. In the industrial context, heat pumps can replace gas-fired boilers by providing the steam and hot water needed for low-temperature processes, such as cooking food and drying paper. In total, these low-temperature applications make up about 35 percent of all U.S. industrial process heat demand.[2]
Central to heat pumps’ advantage over gas and other heating alternatives is their efficient use of energy. Heat pumps use electricity to transfer heat energy between a source and a sink, rather than producing heat from electricity or fuel. While even the best boilers and furnaces lose some energy when converting natural gas to heat, heat pumps instead can produce two to five times more heat energy than the electricity they take in— a feat that no other heating source can claim.
States with low electricity prices and high gas prices are an especially attractive market for heat pumps, as are states with high demand for low-temperature industrial heat, including Virginia, North Carolina, Georgia, and Washington.
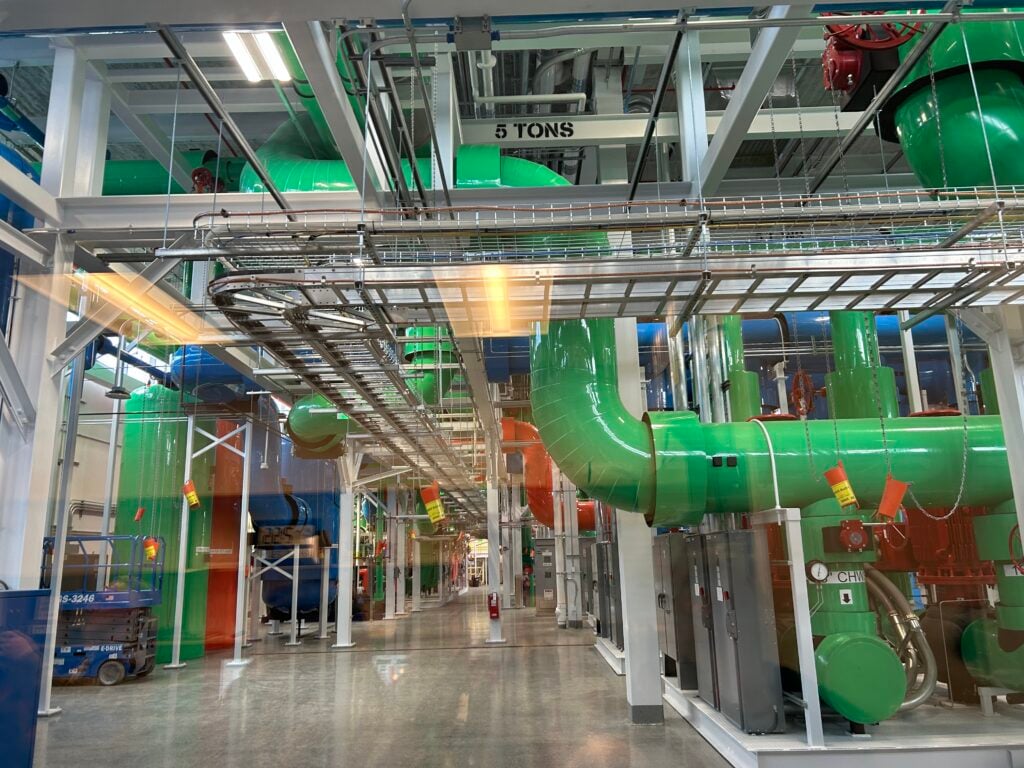
Heat pump at Princeton University
How do the economics of heat pumps compare to gas?
Although U.S. gas prices remain consistently lower than electricity prices on average, heat pumps are often efficient enough to overcome that cost gap, and reliance on gas for heating comes with many caveats.
Gas equipment relies on volatile natural gas spot markets, leaving the price of fuel — and consumer costs — vulnerable to geopolitical forces, especially as the U.S. builds more liquid natural gas export facilitates[3] that increasingly ties domestic production to the global market. Gas prices also see dramatic short-term spikes that can be driven by single events. For instance, Winter Storm Uri in 2021 briefly send the Henry Hub spot[4] to $24 per million British thermal units — more than six times the average price for that year.
Residential Heat Pumps
While heat pumps may require higher upfront costs than gas furnaces, their exceptional efficiency can cut energy costs enough to reduce overall costs — making the technology singular in its ability to make electric heating cost-competitive with gas heating.
Nationwide, residential heat pumps have outsold gas furnaces[5] for four years running, and in September 2025 they passed another milestone when more heat pumps were sold than central air conditioning units. Families are also able to tap state and local government incentives to make heat pumps even more affordable to buy and install.
Industrial Heat Pumps
Heat pumps are poised to boost economic competitiveness and provide other critical economic benefits as well. According to an Energy Innovation simulation,[6] transitioning eligible industrial processes from fossil fuel combustion to heat pumps would increase gross domestic product in the U.S. by more than $42 billion by 2030 and an additional $8 billion by 2050, adding approximately 350,000 jobs across sectors like electricity, construction, finance, and manufacturing over that period.
Switching from gas to electric could also create facility-level cost savings that manufacturers can pass onto consumers.
In the manufacturing sector, heat pumps are best suited for light industries like food and beverage that rely mainly on low-temperature heat (under 200°C, where today’s industrial heat pumps top out). Even though U.S. industry pays around five times more for electricity[7] than for gas[8] on average, research from UC Santa Barbara[9] found that industrial heat pumps can still provide low-temperature heat at lower costs than gas-fired boilers at 12 percent of industrial facilities. And clean energy consulting group E3 found that[10] heat pumps are already cost-competitive enough to replace up to 22 trillion British thermal units of U.S. industrial gas demand, equivalent to the annual natural gas demand[11] of around 390,000 homes. That number would more than quadruple if gas prices were 60 percent higher than the price they modeled.
What about other clean alternatives to burning gas?
Other clean alternatives to gas-fired heating, while promising in other use cases, do not come close to offering the same cost savings as heat pumps.
Electric resistance — Electric resistance is more efficient[12] than gas-fired heat, but heat pumps remain two to five times more efficient than even a perfectly performing electric resistance furnace or boiler. Without the immense efficiency benefits of heat pumps, resistance equipment fails to overcome comparatively higher electricity costs in the same way that heat pumps do.
Renewable natural gas — RNG can be a drop-in replacement for fossil gas in gas-fired equipment with no facility modifications required, making it a seemingly attractive low-carbon alternative. But RNG supplies remain limited: Converting all waste and residue stocks in the U.S. to fuel would meet just 15 percent of national gas demand, while landfill gas[13] would only replace three percent of demand. The outlook for RNG prices remains murky, given limited fuel availability and uncertain demand forecasts.
Hydrogen — Gas utilities are more frequently including hydrogen blending in the distribution system for buildings in their clean energy proposals, but the fuel has no meaningful role[14] as a heating alternative for residential customers due to significant health and safety risks, high costs, and limited emissions reduction potential. While gas utilities use the prospect of hydrogen to justify continued investment in gas pipelines, current systems cannot safely handle a blend of more than 20 percent hydrogen by volume with natural gas. Hydrogen is also an inherently less efficient fuel than gas, only able to deliver roughly one-third of the energy of its natural gas counterpart per unit of volume. Together, these facts mean that even if hydrogen is produced without emitting any greenhouse gases, blending it into the natural gas distribution system would reduce climate pollution by less than seven percent.
Health and safety risks associated with hydrogen can also lead to higher costs for both the consumer and the provider. The highly flammable fuel carries a higher risk of explosions and damaging appliances, and it emits higher rates of the harmful respiratory pollutant nitrogen oxide.
Finally, the high costs of hydrogen simply don’t pencil out for consumers. A meta-review of 54 independent studies[15] found that none of the research supported the possibility of heating with hydrogen at scale, and the evidence overwhelmingly finds hydrogen heating is more costly and less efficient than alternatives — including heat pumps. Overall, the review found hydrogen heating would lead to 86 percent higher consumer costs.
The future of heat pumps
As energy costs rise, heat pumps stand out as a practical, cost-effective alternative to gas across homes, buildings and industry. Their superior efficiency and clear economic benefits make the technology an increasingly compelling choice.
Other low-carbon options may have a role to play in specific applications, but none currently match the scalability and cost advantages of heat pumps. In the absence of federal action, states with ambitious climate goals should look to supporting heat pumps as part of their efforts to enable cleaner air and cheaper energy bills.
[i] Alison F. Takemura, “Heat Pump Sales Dipped In 2025. They Still Beat Gas Furnaces.,” Canary Media., (2026): https://www.canarymedia.com/articles/heat-pumps/heating-cooling-sales-us-gas-furnaces
[ii] Jeffrey Rissman, “Decarbonizing Low-Temperature Industrial Heat In The U.S.,” Energy Innovation, (2022): https://energyinnovation.org/report/decarbonizing-low-temperature-industrial-heat-in-the-u-s/
[iii] U.S. Federal Energy Regulatory Commission, “U.S. LNG Export Terminals – Existing, Approved Not Yet Built, And Proposed,” U.S. Federal Energy Regulatory Commission, (2026): https://www.ferc.gov/media/us-lng-export-terminals-existing-approved-not-yet-built-and-proposed
[iv] U.S. Energy Information Administration, “U.S. Natural Gas Prices Spiked In February 2021, Then Generally Increased Through October,” U.S. Energy Information Administration, (2022): https://www.eia.gov/todayinenergy/detail.php?id=50778&
[v] Alison F. Takemura, “Heat Pump Sales Dipped In 2025. They Still Beat Gas Furnaces.,” Canary Media., (2026): https://www.canarymedia.com/articles/heat-pumps/heating-cooling-sales-us-gas-furnaces
[vi] Jeffrey Rissman, “Decarbonizing Low-Temperature Industrial Heat In The U.S.,” Energy Innovation, (2022): https://energyinnovation.org/report/decarbonizing-low-temperature-industrial-heat-in-the-u-s/
[vii] U.S. Energy Information Administration, “Electric Power Monthly: Table 5.6.A. Average Price of Electricity to Ultimate Customers by End-Use Sector,” U.S. Energy Information Administration, (2026): https://www.eia.gov/electricity/monthly/epm_table_grapher.php?t=epmt_5_6_a
[viii] U.S. Energy Information Administration, “Table 3. Selected National Average Gas Prices, 2020-2025,” U.S. Energy Information Administration, (2026): https://www.eia.gov/naturalgas/monthly/pdf/table_03.pdf
[ix] UC Santa Barbara The 2035 Initiative, “The Clean Heat Climate Opportunity: A Roadmap for Electrifying Low- and Medium-Temperature Industrial Heat,” UC Santa Barbara, (2026): https://www.2035initiative.com/clean-manufacturing
[x] Center for Applied Environmental Law and Policy, “Decarbonizing Industrial Heat: Measuring Economic Potential and Policy Mechanisms,” Center for Applied Environmental Law and Policy, (2024): https://www.ethree.com/wp-content/uploads/2024/10/CAELP-E3-Industrial-Electrification-Report.pdf
[xi] U.S. Energy Information Administration, “Residential Energy Consumption Survey: 2020 RECS Survey Data,” U.S. Energy Information Administration, (2024): https://www.ethree.com/wp-content/uploads/2024/10/CAELP-E3-Industrial-Electrification-Report.pdf
[xii] Center for Applied Environmental Law and Policy, “Decarbonizing Industrial Heat: Measuring Economic Potential and Policy Mechanisms,” Center for Applied Environmental Law and Policy, (2024): https://www.ethree.com/wp-content/uploads/2024/10/CAELP-E3-Industrial-Electrification-Report.pdf
[xiii] Center for Applied Environmental Law and Policy, “Decarbonizing Industrial Heat: Measuring Economic Potential and Policy Mechanisms,” Center for Applied Environmental Law and Policy, (2024): https://www.ethree.com/wp-content/uploads/2024/10/CAELP-E3-Industrial-Electrification-Report.pdf
[xiv] Dan Esposito, “Blending Hydrogen Into Gas Pipelines Would Enrich Utilities And Harm Californians,” Los Angeles Times, (2026): https://www.latimes.com/opinion/story/2026-02-16/hydrogen-california-natural-gas-pipelines
[xv] Jan Rosenow, “A Meta-Review of 54 Studies on Hydrogen Heating,” ScienceDirect, (2024): https://www.sciencedirect.com/science/article/pii/S2949790623000101?ref=pdf_download&fr=RR-2&rr=9e4ff8214d7b93a4
The post Are Electric Heat Pumps Cheaper Than Gas Furnaces? appeared first on Energy Innovation.
Residential heat pumps are outpacing gas furnace sales as the cost, efficiency, and health benefits improve with the technology.
The post Are Electric Heat Pumps Cheaper Than Gas Furnaces? appeared first on Energy Innovation.[#item_full_content]