Despite rising electricity demand across America’s grid and hundreds of millions in new federal subsidies, coal-fired power cannot compete economically with cleaner forms of energy and continues to lose market share across the country.
For 100 years, coal was the nation’s largest source of electricity, but since the beginning of the 21st century, cheaper and cleaner forms of electricity have transformed the United States economy and electric grid. This transition is keeping the U.S. economically competitive on a global scale while improving public health and protecting our environment.
While new energy demand created by artificial intelligence and data centers and pro-coal federal policy have slowed the pace of coal plant retirements, coal’s power generation share continues to decline and in the long-term, retirements remain on track.
Coal power generation cannot economically compete
In 2025, coal composes just 15 percent of U.S. electricity generation, and while 190 gigawatts (GW) of coal capacity remain online, the fleet is down 43 percent from 340 GW at its peak in 2010. This change is largely due to the fact that coal power is simply more expensive than cleaner power sources like wind, solar, batteries, and natural gas.
Electricity demand growth and new actions by the current U.S. presidential administration may slow this decline in the short-term, but with no proposals to build new coal plants anywhere in America and worsening economic competitiveness – particularly where policymakers are strengthening air and water standards to protect their constituents – its long-term share of U.S. electricity generation will continue to decrease.
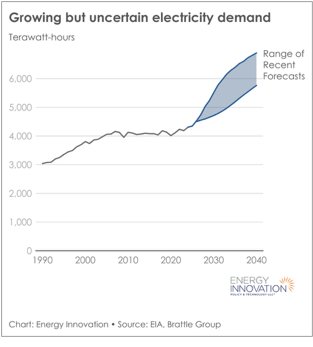
Electricity demand is growing, delaying some coal retirements
Electricity demand projections have increased substantially since 2022, driven by surging data center development alongside manufacturing growth and the electrification of transport and buildings. Some market analysts project up to a 25 percent increase in U.S. electricity demand by 2030.
While significant uncertainty remains in the degree of demand growth, challenges in bringing new resources online in the U.S. have led to delayed retirements at a number of coal plants, with the Global Energy Monitor (GEM) reporting 25.4 GW of delayed retirements with the majority of delays ranging from two to four years. Long-term, more than half of the U.S. coal fleet, 93 GW, is still planned for retirement by 2035, according to GEM.
While current policy has made it more challenging to build clean energy projects, wind, solar, and batteries continue to be the fastest growing resources in the U.S. with nearly 50 GW added in the last 12 months. The U.S. is increasingly relying on clean energy to meet growing electricity needs – over 90 percent of planned electricity generation projects will use wind, solar and batteries as sources of energy.
This dynamic is most obvious in Texas, which saw a 5 percent increase in electricity demand in the first nine months of 2025 compared to the previous nine months. Wind, solar, and batteries increased their share of generation to meet this growth, while the share of coal and gas generation declined.
Source: https://www.eia.gov/todayinenergy/detail.php?id=66464
Current administration actions support coal, but undercut economic decision making
On April 8, 2025, the Trump administration announced several policies to bolster the nation’s coal use, ranging from executive orders to repealing rules on pollution established by the U.S. Environmental Protection Agency.
These actions include granting exemptions to the more stringent Mercury and Air Toxics standards finalized during the previous administration, delaying the compliance date for water pollution rules, and repealing regulations that would require coal to either retire or use carbon capture and storage under Section 111 of the Clean Air Act. These regulations currently require operators to decide between making large investments in upgrades to continue to run their coal plants or shut them down in favor of cheaper resources.
The administration also issued an executive order directing the U.S. Department of Energy (DOE) to use its authority under Section 202(c) of the Federal Power Act, which grants DOE emergency authority to prevent power plants from retiring in order to ensure electricity reliability. While this authority has not historically been used for long-term action, the DOE has already issued several orders to prevent two fossil-fuel fired power plants from retiring.
Costs to keep these plants open have thus far been allocated to electricity consumers, costing ratepayers $80 million between May and November to keep the J.H. Campbell plant open in Michigan, and additional orders to keep plants open could increase ratepayer costs between $3 and $5 billion annually. Through 2028, 27 GW of coal-fired power plants have been scheduled to retire by their state regulators and utilities, but could be impacted by emergency orders to stay online.
The administration also re-appropriated $625 million in federal funds this September to modernize or extend the life of existing coal plants, with an emphasis on gas co-firing and coal-to-gas conversions. This funding is unlikely to meaningfully impact the coal fleet as plants are already reaching end-of-life and individual plant upgrades of this nature can cost hundreds of millions. This funding was tied to an announcement that would open up 13 million additional acres to coal mining, but as the coal fleet burns less fuel additional coal mining operations will remain uneconomic, as evidenced by several failed sales of coal mining rights on public lands this fall.
While these actions may support individual plants in the short term, they are only likely to increase pollution and costs to consumers.
Coal power is increasingly unreliable, expensive and will continue to decline long-term
The average age of coal plants in the U.S. is 44 years, and reliability continues falling as plants get older. North American Electric Reliability Corporation data shows that coal plants experience more frequent unplanned outages than gas, hydro, or nuclear resources. The average unplanned outage rate for coal plants between 2020 and 2023 was 11.4 percent, up from around 8 percent between 2014 and 2017 and higher than both gas (7.7 percent) and nuclear (2 percent).
As coal plants age and their infrastructure deteriorates, they continue to get more expensive. The cost of operating coal plants rose 28 percent between 2021 and 2024, nearly double the rate of inflation in the same period. States that are disproportionately coal-heavy in their electricity generation have seen prices rise faster than others that have diversified into cheaper sources of electricity. Decreased coal power use across the U.S. has complicated coal supply chains and rail transport, which will likely increase coal prices over the long run.
While newer environmental rules have been targeted for repeals by the Trump administration, several longstanding rules still push for increasing pollution controls at plants. Coal plants are large sources of sulfur dioxide (SO2) and nitrogen oxides (NOx), pollutants regulated through national air quality standards and plant-level air permits. In addition, the original standards for mercury and hazardous air pollutants under MATS remain in place. Likewise, coal combustion residual rules requiring management of coal ash and other solid waste remain in place.
Analysis reported in the U.S. Energy Information Administration’s Annual Energy Outlook finds that even with no EPA 111 rules in place, coal power will fall to 7 percent of U.S. electricity generation by 2035.
Clearly, while some short-term delays in coal retirements are happening, the long-term outlook remains largely the same, with the U.S. on a trajectory to continue phasing out coal for cheaper and cleaner resources.
The future of U.S. power is clean
While the U.S. is facing rapid electricity demand growth and current administrative policies are attempting to reinvigorate coal, the long-run trends and economics are inarguable. Coal’s decline will continue and its role on the U.S. electricity system will be very limited because America’s grid needs reliable and affordable sources of energy generation. The proliferation of wind power, solar power, and batteries enable a reliable and affordable grid that keeps consumer costs down, and keeps the air and water clean.
The post What Is Coal’s Future In The United States? appeared first on Energy Innovation.
Coal-fired power cannot compete economically with clean energy and continues losing market share across the United States
The post What Is Coal’s Future In The United States? appeared first on Energy Innovation.[#item_full_content]